Where does revenue come from? And how can we make more of it? When you’re building a business, everything comes down to these two questions. The more specifically you can answer the first, the more opportunities you’ll see to answer the second. To see the big picture, you have to get small. You need to break down your revenue into its smallest logical elements. These are your unit economics — the revenue and cost that goes into each unit of output. You probably calculate this on some level already, even if the term is new to you. But most businesses just scratch the surface of what a laddered view of unit economics can do for profitability.
When you know exactly where your revenue is coming from, priorities become clear. Inefficiencies and opportunities for growth become easy to spot. You start making fewer decisions based on gut feelings and more based on hard data.
Here’s an old improv trick that can help you boost your startup’s profitability:
Build your profitability with this metrics ladder trick
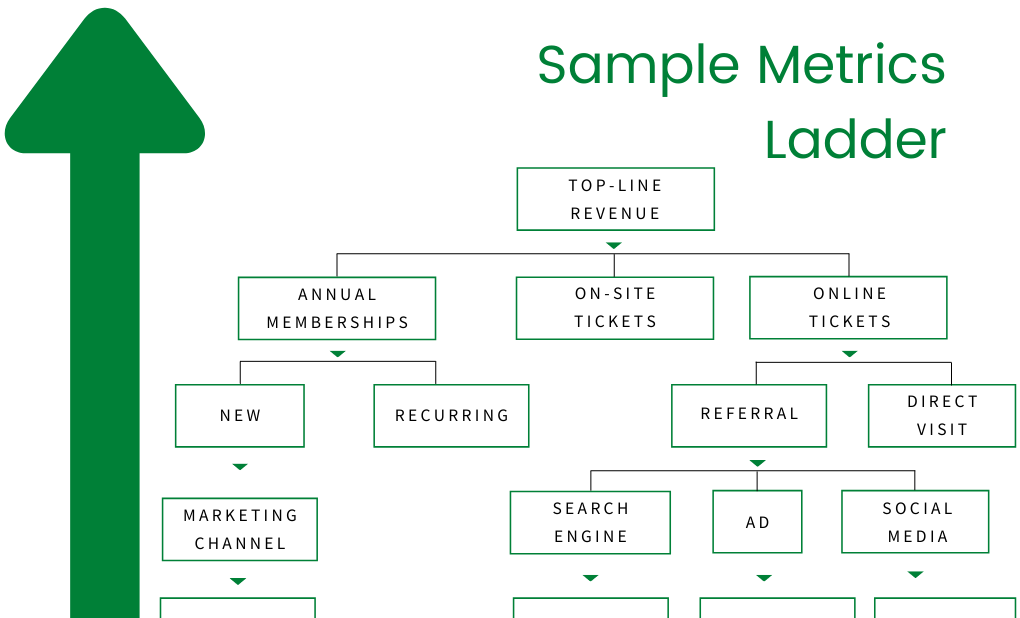
A metrics ladder is a simple diagram that shows how metrics ladder up from the bottom of the funnel to your top-line revenue. It might look like an actual ladder, an organizational chart, a map or a family tree. Whatever visual form it takes, it starts at the top with revenue.
The world of improv has given us a great method for building a metrics ladder. Anyone who’s taken an improv class knows the rule of “yes, and.” It means a performer accepts what their partner has just said (“yes”) and then expands on it (“and”). It’s how the scene is moved along.
“Yes, and-ing” your business breaks down your metrics to give you insight into how the company actually operates.
Take, for example, the below sample metrics ladder for a music venue. In reality, most organizations are far more complex, but this gives us an opportunity to see the basics. Our imaginary venue’s top-line revenue comes from a mix of tickets bought online, tickets bought at the door and annual memberships.
To build the metrics ladder, we play a game of “Yes, and.”
“We did $8 million in top-line revenue last quarter.”
“Yes, and?”
“And of that total, $3 million came from annual memberships, $1 million came from on-site ticket sales and $4 million came from online ticket sales.”
“Four million from online tickets? And?”
“And of that $4 million, $1 million came from direct site visits, and $3 million came from referral traffic.”
“Yes, and?”
You can see how each piece ladders up to the total. Each layer is rich with data about costs, customer behavior and more.
$10K Grants Are Back! Plus, Free Skills Training from Verizon Digital Ready.
Getting everyone on the same page
The different teams in your organization all know what metrics they are tracking, but chances are they don’t really understand how the other teams’ metrics contribute to the bottom line. Everyone is trying to work toward a common goal, but they all speak different languages. The metrics ladder is the Rosetta Stone that translates the jargon and puts everyone on the same page.
When decisions are based on anecdotal evidence, gut feelings and narrow data, you end up with friction between departments. Marketing wants to increase the advertising budget. Operations wants to invest in the facility. Tech wants to build the developer team. Everyone has a good argument and numbers to back it up. The problem is, their numbers were collected in a vacuum. They don’t take into account how these projects fit into the bigger picture.
The visual nature of a metrics ladder puts everyone on the same page. It’s a single source of truth. Everyone can see what’s driving the bottom line and where opportunities lie.
Should a Side Hustle or E-Commerce Business File for Incorporation?
Using the data
Data is all well and good, but it doesn’t become valuable until you use it. Once you’ve placed your metrics in a metrics ladder, you can use it to optimize your operation.
- Marketing: A metrics ladder makes opportunities to make the most of your marketing readily apparent. If a large number of the venue’s repeat customers share a ZIP code, it makes sense to target that area for a campaign pushing annual memberships. If the customer acquisition costs of a Facebook ad are half the customer acquisition cost of a Google ad, the venue can shift ad spend to maximize its marketing budget.
- Staffing: Identifying when on-site sales are at their heaviest could help the venue staff appropriately, so customers aren’t frustrated by long waits at busy times, and staffers aren’t left with nothing to do at slow times.
- Operations: Staffing is just one example of operational efficiency that could be revealed by the metrics ladder. The venue might find it’s losing profitability and money on the drink specials intended to get people in the door. Optimizing the online ticketing experience could boost advance ticket sales. That in turn could ease congestion at the door and make planning easier.
Find free courses, mentorship, networking and grants created just for small businesses.
Key takeaways on using a metrics ladder to boost your profitability
Most startups are obsessively tracking metrics but have only a spotty understanding of how they relate to one another and how they influence the organization as a whole. Putting them into a framework like a metrics ladder reveals those hidden connections.
The metrics ladder’s greatest strength is its ability to align the team that is behind the many pressing projects they can turn into priorities. You’re probably already tracking objectives and key results (and if you’re not, you should be). Getting everyone on the same page with a metrics ladder not only helps your organization to use its resources efficiently, but it can reduce interpersonal friction and improve morale. After all, to most startups, the only thing as important as profitability and revenue is people.
Originally published Aug. 12, 2021.


